Here are some specific activities, investigations or visual aids we have picked out. Click anywhere in the grey area to access the resource.
 Averages Video Revise how to calculate the mean, median, mode and range from lists and frequency tables.
 Bar Charts Practise constructing and interpreting bar charts for everyday situations.
 Pictograms Show that you can make sense of data displayed as pictograms and create some pictograms of your own.
 Pie Charts Develop the skills to construct and interpret pie charts in this self-marking set of exercises.
 Pie Chart Creator A quick and convenient tool for rapidly creating simple pie charts.
 Averages Test your understanding of averages with this self marking quiz about mean, median and range.
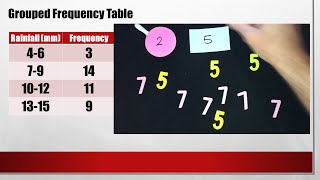
 Histograms Practise drawing and reading information from histograms displaying grouped data
 Tally Charts Read and draw simple tally charts to record and count different types of data.
 Tally Charts Video A guided tour through the levels of the Tally Charts online exercise.
 Reading Graphs and Charts Answer real-life problems from different types of graphs and charts including piece-wise linear graphs.
 StatGrid Challenge Arrange the numbers one to nine in a three by three grid to obtain the given means, medians and ranges.
 Comparing Graphs Would you recognise a misleading graph if you saw one? Try this comparative judgement exercise to rate statistical graphs.
 Stem and Leaf Diagrams Practise your ability to read and construct stem-and-leaf diagrams for statistical data.
 First Impressions This activity will collect data about your first impressions of some optical illusions. You can then analyse the data to come to your own conclusions.
Here are some exam-style questions on this statement:
- "The table shows information about the heights of 85 stalagmites." ... more
- "The height, \(h\) cm, of each of 100 standing meerkats is measured. The table shows the results." ... more
- "155 people were asked how much money they would pay for particular three-course meal in a special restaurant." ... more
- "The following table shows the time taken by fifty people to answer their emails one day." ... more
- "The following table show data collected by a researcher about the length of monitor lizards living in a park in Bangkok." ... more
- "The histogram gives information about the distribution of the heights of some shrubs grown by a garden supplier." ... more
- "The following table shows the number of days families spend in a particular seaside hotel in August last year." ... more
- "The personal trainer collected data from a randomly selected sample of days. From this he found that the number glasses of water he drank in a day had a mean of 4.35. " ... more
Click on a topic below for suggested lesson Starters, resources and activities from Transum.
How do you teach this topic? Do you have any tips or suggestions for other teachers? It is always useful to receive feedback and helps make these free resources even more useful for Maths teachers anywhere in the world. Click here to enter your comments.