Here are some specific activities, investigations or visual aids we have picked out. Click anywhere in the grey area to access the resource.
 The Beauty of Data Visualization Complex data sets (like military spending, media buzz, Facebook updates) are turned into beautiful, simple diagrams.
 Visualising Data Hans Rosling's famous lectures combine enormous quantities of public data with a sport's commentator's style to reveal the story of the world's past, present and future development.
 Comparing Data Compare two distributions using appropriate measures of central tendency and spread.
 Stem and Leaf Diagrams Practise your ability to read and construct stem-and-leaf diagrams for statistical data.
 Quartiles Practise processing the sets of numbers to find the lower and upper quartiles.
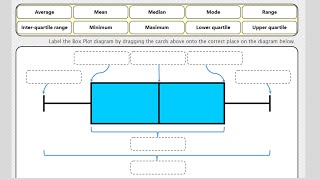 Box Plots Video Box plots, sometimes called box and whisker diagrams, are a useful way of visualising data.
 Box Plots An exercise on reading and drawing box-and-whisker diagrams which represent statistical data.
 First Impressions This activity will collect data about your first impressions of some optical illusions. You can then analyse the data to come to your own conclusions.
Here are some exam-style questions on this statement:
- "(a) The list shows 18 temperatures, in degrees Celsius, at 2pm on different days in Honeyville." ... more
- "The box plot shows information about the distribution of the times (in minutes) groups of customers spend in a open-air restaurant." ... more
- "The range, mode, median and mean of five positive integers are all equal to 8. Find two different possible sets of these five integers." ... more
- "Kevin recorded the heights, in centimetres, of some cows." ... more
- "The scatter graph gives information about the marks earned in a Statistic exam and a Mathematics exam by each of 13 students." ... more
- "Here is some information about the length of time children spent in a swimming pool at a holiday resort during a heat wave." ... more
- "One day a theme park monitored the time spent by guests at six different areas of the park. The times are recorded in the box plots below." ... more
- "The distribution of daily average wind speed on an island over a period of 120 days is displayed on this box-and-whisker diagram." ... more
- "Derek has put together a fantasy football squad and has recorded the heights of all the players in the squad rounded to the nearest centimetre. The data is illustrated in the following box and whisker diagram." ... more
- "The charts below show the results of pupils in a Year Group answering twenty mental arithmetic questions." ... more
- "Poppy Pringle recorded the heights in centimetres of the sunflowers growing in her brother's and sister's gardens." ... more
- "A number of organically-grown carrots were measured (in centimetres) and the results recorded. The following box and whisker diagram shows a summary of the results where L and U are the lower and upper quartiles respectively. The diagram is not drawn to scale." ... more
Click on a topic below for suggested lesson Starters, resources and activities from Transum.
Furthermore
If you use a TI-Nspire GDC there are instructions useful for drawing box plots.
There are actually four different methods for calculating the quartiles of a data set. These are explained on the Wikipedia page on quartiles. For discrete data, it turns out that there is no universal agreement on how to determine quartile values.
For example, consider the ordered data set: 6, 7, 15, 36, 39, 40, 41, 42, 43, 47, 49.
Here are the lower quartiles calculated using four different methods:
| Method | Lower Quartile |
|---|---|
| Method 1 | 15 |
| Method 2 | 25.5 |
| Method 3 | 20.25 |
| Method 4 | 15 |
This variation in results highlights the nuances in statistical definitions that we often overlook. It's fascinating (and humbling) to realise that even concepts we thought were straightforward can be approached in multiple ways, depending on the methodology used.
How do you teach this topic? Do you have any tips or suggestions for other teachers? It is always useful to receive feedback and helps make these free resources even more useful for Maths teachers anywhere in the world. Click here to enter your comments.